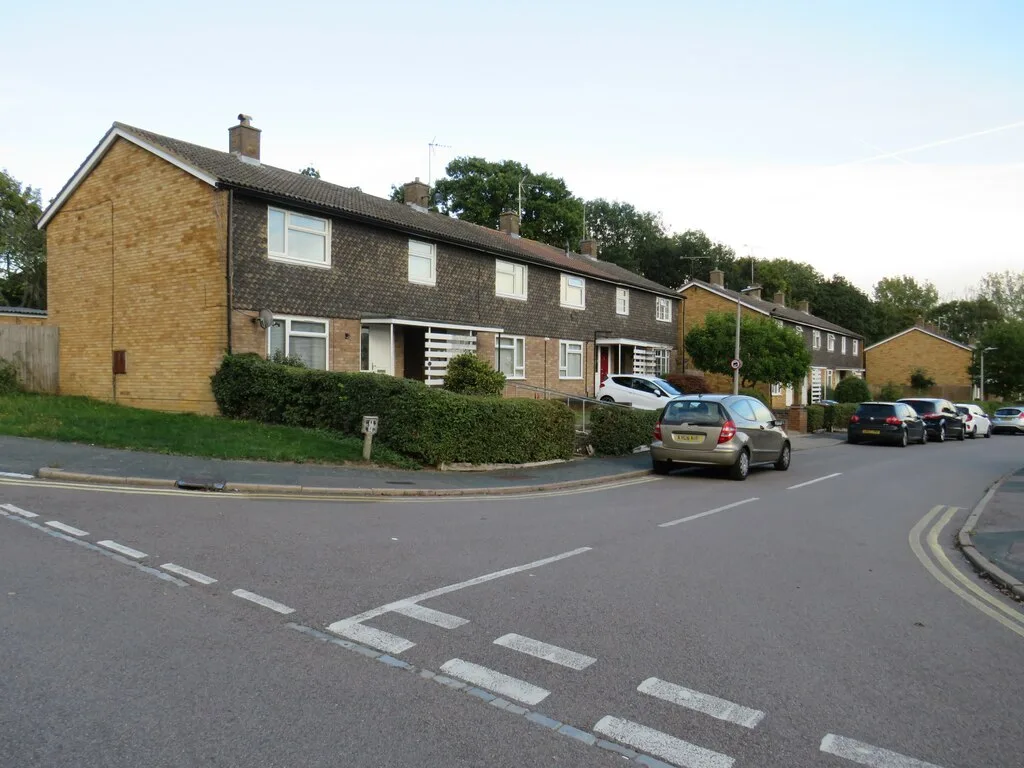

The average Stevenage home sold for £316,210 in July 2026, £153,000 below the county average and the cheapest of Hertfordshire's ten districts. Median by ward.
The average home in Stevenage borough sold for £316,210 in July 2026, the most recent month published in the official UK House Price Index. That is up 1.8% over twelve months but down £7,059 on June, a 2.2% fall in one month and the sharpest since December 2024. The borough is £18,947 below its November 2022 peak of £335,157.
One number puts that in context. Stevenage is the cheapest of Hertfordshire’s ten districts, and not by a small margin: the county average in the same month was £469,474, so a typical Stevenage home costs about £153,000 less than a typical Hertfordshire one. It is also the only district in the county with an average under £400,000.
Stevenage against the rest of Hertfordshire
All figures are district averages for July 2026 from the UK House Price Index.
| Area | Average price, July 2026 | Change over 12 months |
|---|---|---|
| St Albans | £646,781 | +2.3% |
| Three Rivers | £590,816 | +2.3% |
| Hertsmere | £548,704 | +1.3% |
| Hertfordshire | £469,474 | +2.7% |
| Dacorum | £459,235 | +3.0% |
| East Hertfordshire | £457,417 | +3.7% |
| Welwyn Hatfield | £448,681 | +3.0% |
| North Hertfordshire | £418,857 | +5.3% |
| Broxbourne | £411,689 | +2.5% |
| Watford | £404,299 | -0.7% |
| Stevenage | £316,210 | +1.8% |
| England | £293,479 | +1.1% |
That gap is the single most useful thing to know about the Stevenage market. You are buying into a town with 24-minute peak trains to King’s Cross at roughly two-thirds of the Hertfordshire price.
Stevenage sits closer to the England average than to the county it belongs to: about £23,000 above England, about £153,000 below Hertfordshire. The reason is the housing stock rather than the location. Stevenage was built from 1946 as the first New Town, in neighbourhoods of terraces and semis with a comparatively small share of large detached houses, while St Albans, Harpenden and the Three Rivers villages are full of exactly the period stock that carries the county average.
Stevenage’s 1.8% annual rise is now eighth of the ten districts, well behind North Hertfordshire’s 5.3% and East Hertfordshire’s 3.7%. Watford is the only district in the county to have gone backwards over the year.
What you pay by property type
District averages for July 2026, again from the UK House Price Index:
- Detached: £644,212, up 1.2% over the year.
- Semi-detached: £395,541, up 2.9%, the strongest of the four.
- Terraced: £313,999, up 2.7%.
- Flats and maisonettes: £171,538, down 1.0%, the only type worth less than a year ago.
A detached house in Stevenage costs 3.8 times a flat. That spread matters when you read any area comparison, here or anywhere else: a Stevenage ward’s average tells you as much about what kind of homes it contains as about how sought-after it is.
The index also splits buyers. A first-time buyer paid an average of £279,901 in July 2026, up 1.9% over the year. A former owner-occupier, someone selling one home to buy another, paid £388,445. The gap of roughly £109,000 is the size of the step from a flat or terrace to a family house in this borough.
Median sold price by ward
The figures above are mix-adjusted index averages for the whole borough. To see inside it, we pulled every residential sale registered with HM Land Registry in the SG1 and SG2 postcode areas for the year to 30 June 2026, looked each postcode up on postcodes.io to find its council area and ward, and kept only the 816 sales inside Stevenage borough. Both outcodes spill over the boundary, so the 94 sales that fell into North Hertfordshire (mostly Great Ashby) and the 40 in East Hertfordshire (Walkern, Aston, Benington) are excluded.
The borough-wide median from those 816 sales is £345,000. A quarter sold for under £292,125 and a quarter for over £390,000.
Woodfield is the dearest ward at a median of £418,000, and the reason is visible in its mix: 19 of its 49 sales were detached houses, at a median of £717,000. The Old Town comes second at £375,000, where the premium is the pre-New Town housing around the High Street rather than the size of the plots.
At the other end, St Nicholas (£310,000) and Bedwell (£313,500) are the cheapest, and both are dominated by terraces: 46 of St Nicholas’s 61 sales and 33 of Bedwell’s 42 were terraced houses. St Nicholas also recorded the borough’s cheapest flats, at a median of £104,250 across 14 sales.
The striking thing is how narrow the whole range is. From cheapest ward to dearest is £108,000, about 35%. In most towns of this size the gap runs to a multiple. A New Town built to one plan over three decades produces a market with very little variation in it, which is good news if you are buying and awkward if you were hoping your street was special.
The one thing that skews every Stevenage average
Terraces are 58% of the market. Of the 816 borough sales, 472 were terraced houses, against 128 flats, 120 semis and just 96 detached homes. Medians by type across the borough:
| Property type | Sales | Median price |
|---|---|---|
| Detached | 96 | £562,500 |
| Semi-detached | 120 | £397,000 |
| Terraced | 472 | £335,000 |
| Flats and maisonettes | 128 | £195,000 |
Because terraces dominate, the borough median tracks the terraced median closely, and any “average Stevenage house price” you read is, in practice, mostly a statement about terraces. If you are looking at a detached house here you are shopping in a market of fewer than a hundred sales a year.
The full range across the year ran from £68,250 to £1,485,000. Only 83 sales, one in ten, cleared £500,000, and 146 came in under £250,000.
Why the two headline numbers differ
You will notice the UK House Price Index says £316,210 and the raw sales say a median of £345,000. Both are correct and they measure different things. The index is mix-adjusted and modelled, so it estimates the price of a consistent “standard” property month by month and is not the arithmetic average of one month’s sales. The £345,000 is the plain middle sale from a year of registered transactions. Use the index to see which way the market is moving and the median to see what people actually paid.
Just over the boundary
Great Ashby is worth flagging because it looks like Stevenage on the ground but is not Stevenage on paper. Built from the 1990s on the town’s north-eastern edge, it sits in North Hertfordshire district, and its 93 sales in our window had a median of £385,000, £40,000 above the Stevenage figure. That difference is the newer, larger housing rather than the council boundary, but the boundary is what decides your bin day, your council tax band and who rules on the application next door.
Frequently asked questions
What is the average house price in Stevenage?
The average home in Stevenage borough sold for £316,210 in July 2026, according to the UK House Price Index built from HM Land Registry sales. Across a full year of registered sales the median was £345,000.
Are Stevenage house prices going up in 2026?
Over the year, yes, but the rise has slowed sharply. Prices were up 1.8% in the year to July 2026, eighth of the ten Hertfordshire districts. July itself was down 2.2% on June, a fall of £7,059 and the borough’s sharpest monthly drop since December 2024.
Is Stevenage the cheapest place to buy in Hertfordshire?
Yes, on the district averages. At £316,210 it is below Watford (£404,299) and Broxbourne (£411,689), and less than half the St Albans average of £646,781.
Which is the most expensive part of Stevenage?
Woodfield, at a median of £418,000 over the year to June 2026, followed by the Old Town at £375,000. The cheapest wards are St Nicholas (£310,000) and Bedwell (£313,500).
How much is a terraced house in Stevenage?
The median terraced sale was £335,000 across 472 sales in the year to June 2026. Terraces are 58% of everything that changes hands here.
Where can I check what a specific house sold for?
Every completed sale in England and Wales is public. Look up a street or an address free on the HM Land Registry Price Paid service.
Sources
- UK House Price Index, Stevenage, July 2026 (HM Land Registry) for the district average, annual change, property-type and buyer-type figures, and the full July 2026 data file for the district comparison table.
- UK House Price Index local visualisation, Stevenage (ONS) for the same series in chart form.
- HM Land Registry Price Paid data for the 816 borough sales behind the ward medians, with ward lookups from postcodes.io.
- HM Land Registry Price Paid search to check any individual address.
Index figures are provisional and revised as more sales complete. Confirm the latest numbers against the linked sources before making a decision.
Have your say